User Manual
Start with ECG SmartApp
- Be sure that the battery (max voltage supply: 9V) connected to the device is charged
- Clean the skin before placing electrodes. Dry dead skin layer, usually present on the surface of our body, and possible air gaps between the skin and the electrodes do not facilitate the ECG signal transmission to the electrodes. So a moist condition between the electrode and the skin is needed. The skin needs to be cleaned (tissue cloth soaked with alcohol or at least water) before placing the electrode gel pads (disposable).
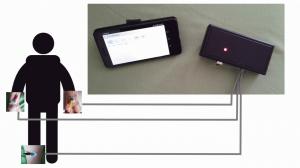
- Place the electrodes according to the table below. In case of a non-disposable electrode, electrode conductive gel (available commercially) should be used between the skin and the metal electrode or at least a pad of cloth tissue soaked in tap water or in saline solution.
| ECG Lead (limb leads) | Red electrode | Yellow electrode | Black electrode |
| LI | Right Arm | Left Arm | Right Leg |
| LII | Right Arm | Left Leg | Right Leg |
| LIII | Left Arm | Left Leg | Right Leg |
The device allows to record the ECG (LI, LII or LIII) also by using only 2 electrodes; the reference electrode (black) is optional and can be excluded by using a switch or removing the jumper J1 (see Assembly Manual). However, the reference electrode should be used to have a better signal quality (lower noise).
- Power on the ECG device by using the switch (red led turns on)
- Run the App on the smartphone
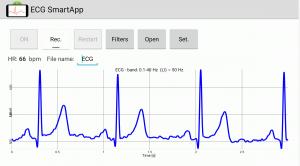
- Press the button “ON” to connect the smartphone to the ECG device (the App will ask you the permission to turn on Bluetooth: press “Yes”) and wait for the discovery of the HC-06 (or HC-05) Bluetooth Module of the ECG device. Pairing code or password may be asked in case of the first Bluetooth connection with the module: enter “1234”. If the App does not find the Bluetooth Module, try to pair the smartphone with the HC-06 (or HC-05) Bluetooth Module by using the smartphone Bluetooth Setting (pairing code “1234”); this operation is needed only once (first connection)
- When the connection is established, the ECG signal will appear on the screen; in case of LI (default lead is LI, to change lead please go to the “Setting” paragraph) the heart rate (HR) will be estimated in real time. The signal will be updated every 3 seconds
- To apply a digital filter, press “Filter” button and choose a filter from the list. By default, a low pass filter @ 40 Hz and a notch filter (according to the preferences saved in the Setting) are applied.
Settings
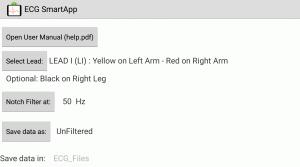
- Press the button “Set.” to open the setting/preferences page
- Press “User Manual (help.pdf)” to open the user manual file
- Select the ECG lead (LI is default)
- Select the notch filter frequency (according to the interference frequency: 50 or 60 Hz)
- Select the file saving option to save the ECG signal filtered or unfiltered on the file
- Press the button “Save settings” to save the preferences
Gain value can be changed in case of hardware modification or personalization of the ECG device.
Recording ECG signal
- Insert the file name (if the user records more ECG signals in the same session without changing the file name, a progressive index is added at the end of the file name to avoid overwriting the previous recording)
- Press “Rec.” button to start recording the ECG signal
- Press “Stop” button to stop the recording
- Each ECG signal will be stored in a txt file inside the folder “ECG_Files” placed in the main root of the smartphone memory. ECG signal can be stored filtered or unfiltered according to the preferences saved in the setting
- Press “Restart” button to visualize again the ECG signal acquired in run time
- To record a new ECG signal, repeat the previous points
An ECG file contain the series of the samples (sampling frequency: 600 Hz) of the ECG signal amplitude in mV.
Opening and analyze an ECG file
- Press “Open” button: a list of the files stored in the “ECG_Files” folder will appear
- Choose the ECG file to be visualized
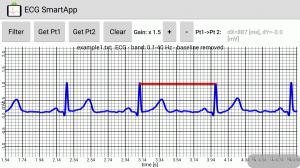
The first part of the ECG file will be displayed (10 seconds) with no grid.
The user can scroll manually on the display to visualize any time interval of the ECG signal.
To zoom in or zoom out the user can press on the magnifying glass icons (right corner at the bottom of the graph) or use the pinch zoom directly on the smartphone display.
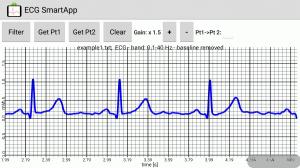
Time axis, voltage axis and the standard ECG grid will automatically appear when a time interval lower than 5 seconds will be visualized (by zooming in). Voltage axis (y-axis) values are in mV while time-axis (x-axis) values are in seconds.
To apply a digital filter, press “Filter” button and choose a filter from the list. By default a low pass filter @ 40 Hz, a filter to remove the wandering line and a notch filter (according to the preferences saved in the setting) are applied. The graph title displays:
- the file name
- the ECG frequency band according to the applied filters
- the label “wandering baseline removed” if the wandering baseline filter is applied
- the label “~ 50” or “~ 60” according to the applied notch filter
The user can make measurements (time interval or amplitude) between two points of the graph by using the “Get Pt1” and “Get Pt2” buttons. To choose the first point (Pt1) the user can press “Get Pt1” and select manually a point of the ECG signal by clicking directly on the graph: a red point will appear on the ECG blue signal; if the user misses the ECG curve, no point will be selected and the “no point selected” string will appear: the user has to repeat the selection. The same procedure is needed to choose the second point (Pt2). In this way, the differences (Pt2 – Pt1) of the time values in ms (dX) and the amplitude values in mV (dY) will be displayed. The “Clear” button clears the selected points.
The user can adjust the ECG signal gain by using the “+” button (to enlarge) and “-“ button (to reduce); maximum gain: 5.0 and minimum gain: 0.5
Filters menu
- NO digital Filter: remove all applied digital filters
- Remove wandering baseline: apply a particular processing to remove the wandering of the baseline. In case of a signal very noisy, the processing may fail
- High pass ‘x’ Hz: apply an IIR high pass filter according to the specified cut off frequency ‘x’
- Low pass ‘x’ Hz: apply an IIR low pass filter according to the specified cut off frequency ‘x’
- 50 Hz removal ON (notch+LowPass 25 Hz): apply a particular very stable FIR filter that is both a notch at 50 Hz and a Low Pass at around 25 Hz
- 60 Hz removal ON (notch+LowPass 25 Hz): apply a particular very stable FIR filter that is both a notch at 60 Hz and a Low Pass at around 25 Hz
- 50 Hz removal ON: apply a recursive notch filter at 50 Hz
- 60 Hz removal ON: apply a recursive notch filter at 60 Hz
- 50/60 Hz removal OFF: remove the applied notch filter
Hardware Specifications
- Max Input signal amplitude (peak-to-peak): 3.6 mV (Max Input signal amplitude depends on the hardware gain)
- Voltage supply: USE ONLY BATTERIES (both rechargeable and not rechargeable)
- Min Voltage supply: 6V (e.g. 4 x 1.5V batteries)
- Max Voltage supply: 9V (e.g. 6 x 1.5V or 1 x 9V batteries)
- Sampling frequency: 600 Hz
- Frequency Bandwidth @ - 3dB (Hardware): 0.1 Hz - 40 Hz (The upper band limit of the low pass filter can be increased up 0.1 Hz - 150 Hz, by changing RC filter components (see Assembly Manual)
- CMRR: min1209 dB
- Amplification (Hardware_Gain): 1005 (it can be changed by replacing the gain resistor (see Assembly Manual)
- Resolution: 5V / ( 1024 x Hardware_Gain )
- Bias Current max 10 nA
- Number of ECG channels: 1
- ECG Leads: limb leads LI, LII and LIII
- Smartphone connection: via Bluetooth
- Theoretical Supply Current: < 50 mA (Based on the datasheet info of the different components)
Measured Supply Current: < 60 mA (With a 9V voltage supply and Arduino Nano)
- Number of electrodes: 2 or 3
The device allows to record the ECG (LI, LII or LIII) also by using only 2 electrodes; the reference electrode (black) is optional and can be excluded by removing the jumper J1 (or the switch S2, see Assembly Manual file). However, the reference electrode should be used to have a better signal quality (lower noise).
Software Specifications
- ECG visualization during the recording (time window: 3 seconds)
- Heart Rate estimation (only for LI)
- Sampling frequency: 600 Hz
- ECG signal recording and saving into a txt file (filtered or unfiltered signals can be saved in the txt file according to the setting) on the smartphone internal memory (folder: “ECG_Files” placed in the main root)
- Data (samples) are saved as values in mV at 600 Hz (value of 16 digits)
- Saved file visualization with zoom option, grid, gain adjusting (from “x 0.5” to “x 5”) and two points selection (to measure time distance and amplitude difference)
- Smartphone display: the App layout adjusts for different display size; however for a better visualization, it is recommended minimum a 3.7’’ display with a resolution of 480 x 800 pixels
Digital filtering:
- High pass filtering @ 0.1 , 0.15 , 0.25 , 0.5, 1 Hz
- Low pass filtering @ 25, 35, 40 Hz (@ 100 and 150 Hz are available in the ECG SmartApp version for bandwidth at 150 Hz)
- Notch filtering to remove the powerline interference @ 50 or 60 Hz
- Wandering baseline removal


