The ECG SmartApp
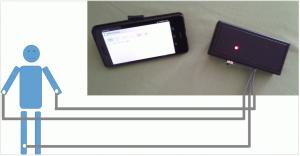
The App visualizes the ECG signal in real time and gives the possibility to filter, make measurements and store the signal in a file.
Download the User Manual for detailed instructions for use.
Start with ECG SmartApp
Be sure that the battery (max voltage supply: 9V) connected to the device is charged
Clean the skin and place the electrodes
Power on the ECG device and run the App on the smartphone
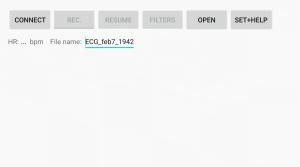
Press the button “Connect” to connect the smartphone to the ECG device (you need to turn on the ECG device and grant the permission to access Bluetooth/Location; pairing code or password may be asked in case of the first Bluetooth connection with the module: enter “1234”). If the App does not find the Bluetooth Module, try to pair the smartphone with the HC-06 (or HC-05) Bluetooth Module by using the smartphone Bluetooth Setting. If the App does not connect to the Bluetooth Module, try to close the App and open it again leaving the Bluetooth connection turned ON on your mobile.
When the connection is established, the ECG signal will appear on the screen. The signal will be updated every 3 seconds.
To apply a digital filter, press “Filter” button and choose a filter from the list. By default, a low pass filter @ 40 Hz and a notch filter (@ 50 or 60 Hz, according to the preferences saved in the Setting) are applied.
Press “Rec.” button to start recording the ECG signal
Press “Stop” button to stop the recording
Press “Resume” button to visualize again the ECG signal acquired in run time
An ECG file contain the series of the samples (sampling frequency: 600 Hz) of the ECG signal amplitude in mV
Opening and analyze an ECG file
Press “Open” and choose the ECG file to be visualized
The first part of the ECG file will be displayed (10 seconds) with no grid.
The user can scroll manually on the display to visualize any time interval of the ECG signal.
To zoom in or zoom out the user can press on the magnifying glass icons (right corner at the bottom of the graph) or use the pinch zoom directly on the smartphone display.
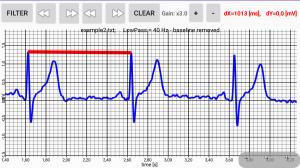
Time axis, voltage axis and the standard ECG grid will automatically appear when a time interval lower than 5 seconds will be visualized (by zooming in). Voltage axis (y-axis) values are in mV while time-axis (x-axis) values are in seconds.
To apply a digital filter, press “Filter” button to apply a filter from the list or to remove the wandering baseline. By default, a low pass filter @ 40 Hz and a notch filter (50 or 60 Hz, according to the preferences saved in the setting) are applied.
The user can make measurements (time interval or amplitude) through a caliper tool between two points of the graph by using the “Get Pt1” and “Get Pt2” buttons.
The “Clear” button clears the selected points.
The user can adjust the ECG signal gain by using the “+” button (to enlarge) and “-“ button (to reduce); maximum gain: 5.0 and minimum gain: 0.5
Troubleshooting
The mobile App does not connect to the ECG device:
a) The battery may be discharged
b) Try to close the App, enable manually the Bluetooth connection on the smartphone and run the App again
c) In case of Android 10 or higher, try to close the App, enable both the Bluetooth connection and device Location on the smartphone, run the App again.
d) Try to enable manually the STORAGE pemission (and LOCATION permission for Android 10 or higher) in the App info menu or mobile setting and run the App again
e) It may happen a Bluetooth connection issue for some Android One devices and in rare cases also for Android 10. Try another Android 10 device or use a device with an android version lower than Android 10.
Bluetooth Pairing code:
if asked, enter “1234”, if the App does not find the Bluetooth Module, try to pair the smartphone with the HC-06 (or HC-05) Bluetooth Module by using the smartphone Bluetooth Setting.
Noisy ECG signal:
the battery may be discharged; if using a 6V battery, try to use a higher voltage battery as 9V (use ONLY battery - max voltage supply: 9V).
Problem for sharing ECG recording files by pressing the "share button":
it may happen in few cases. Try to share/send/copy the ECG recording files manually from the device storage (see the App Info section to find out the ECG recording folder path).
SOFTWARE SPECIFICATIONS
ECG visualization during the recording (time window: 3 seconds)
Heart Rate estimation (only for LI)
Sampling frequency: 600 Hz
ECG signal recording and saving into a .txt file (filtered or unfiltered signals can be saved in the txt file according to the setting) inside the folder “ECG_Files” placed in the local app data folder of the smartphone memory (e.g. …\Android\data\com.example.ecgsmartapp\files\ECG_Files). ECG signal can be stored filtered or unfiltered according to the preferences saved in the setting
Data (samples) are saved in the .txt file as values in mV at 600 Hz (value of 16 digit)
Saved file visualization with zoom option, grid, gain adjusting (from “x 0.5” to “x 5”) and two points selection (to measure time distance and amplitude difference)
Smartphone display: the App layout adjusts for different display size; however for a better visualization, it is recommended minimum a 5.2’’ display.
Digital filtering:
High pass filtering @ 0.1 , 0.15 , 0.25 , 0.5
Low pas filtering @ 25, 35, 40 Hz (@ 100 and 150 Hz are disabled since in case they do not make sense in a hardware configuration of 40 Hz max frequency)
Notch filtering to remove the powerline interference @ 50 or 60 Hz
wandering baseline removal (a digital signal processing is applied to detect the series of Q points of the ECG waves; a linear interpolation is made between two consecutive Q points to have an estimation of the wandering baseline that is subtracted from the ECG signal)


